

.svg)



You do not need to become an analytics expert to understand whether your website is working. Start with its goals, a handful of useful metrics, and a simple habit of reviewing what changed.
Google Analytics 4—usually shortened to GA4—can help you understand how people discover your website, which content they use, and whether they complete actions that matter to your organization.
The interface can feel overwhelming at first because it offers far more information than most website owners need. This guide explains the foundation in plain language so you can review your website with confidence before exploring individual reports.
What Google Analytics 4 Can Help You Understand
At its most useful, GA4 helps answer four questions:
- Who is visiting the website?
- How are visitors finding it?
- What do visitors do after arriving?
- Are they completing meaningful actions?
Analytics cannot tell you everything. It cannot fully explain why someone trusted a message, disliked a design, or decided not to contact you. It gives you behavioral evidence that can guide better questions and decisions.
Use GA4 alongside customer feedback, sales conversations, usability observations, and your knowledge of the organization.
Begin With the Website’s Goals
Before reviewing traffic, define what the website is supposed to accomplish.
A service business may want visitors to submit an inquiry or schedule a consultation. A nonprofit may prioritize donations, volunteer registrations, or newsletter signups. A political campaign may track contributions, volunteer interest, and visits to its issues pages.
Write down the three to five actions that matter most. These become the foundation of your analytics setup and monthly reporting.
Common website goals include:
- Contact-form submissions
- Appointment bookings
- Donations or purchases
- Newsletter signups
- Phone-number and email-address clicks
- File downloads
- Volunteer or event registrations
Understand Events and Key Events
GA4 records interactions as events. A page view is an event. Depending on the site’s setup, clicks, scrolls, downloads, video activity, form submissions, and purchases may also be recorded as events.
The actions that matter most to the organization can be designated as key events.
This distinction is important:
- Events show what visitors did.
- Key events identify which actions support the website’s goals.
Without properly configured key events, GA4 may show that traffic increased while leaving you unable to tell whether inquiries, donations, registrations, or purchases improved.
Do not assume every important action is already tracked. Test forms, buttons, downloads, and third-party tools to confirm that the expected events appear.
The Essential GA4 Metrics
You do not need to memorize every metric. These six measurements provide a useful starting point.
Users
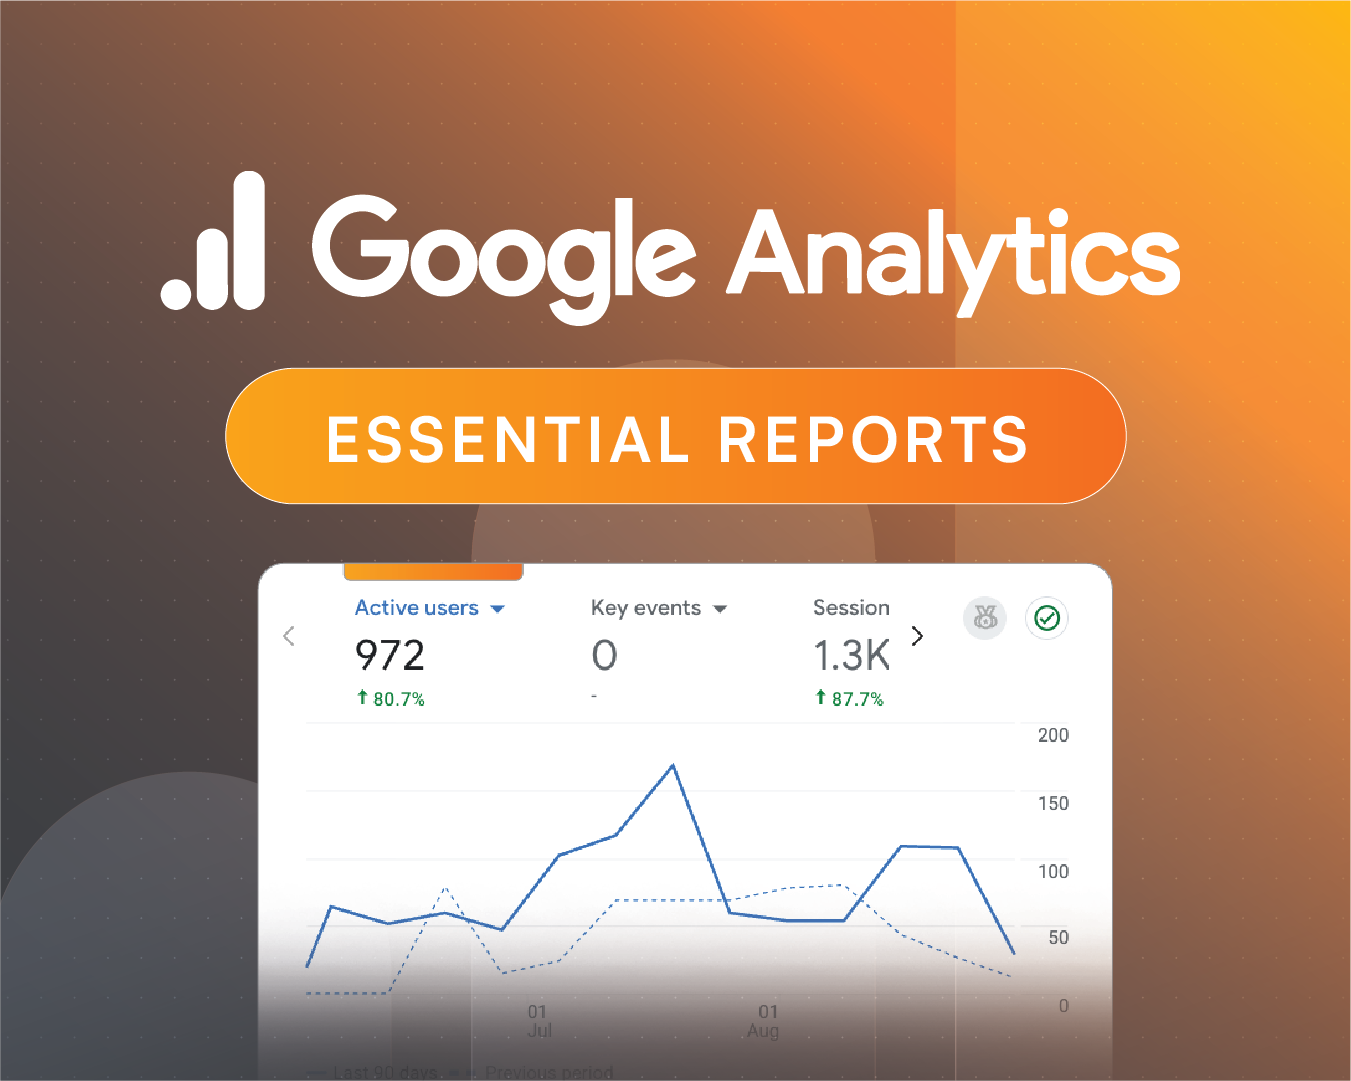
Users represent people who interacted with the website during the selected period. GA4 distinguishes between active, new, total, and returning users, so totals can vary between reports.
New Users
New users are people who interacted with the website for the first time. This can help show whether the organization is reaching new audiences.
Sessions
A session is a period during which someone interacts with the website. One person can generate several sessions by returning more than once.
Views
Views count the pages or screens visitors viewed. One visitor reading five pages can generate five views.
Engagement Rate
Engagement rate is the percentage of sessions GA4 considers engaged. An engaged session lasts at least 10 seconds, includes a key event, or includes at least two page or screen views. Google explains this metric in its Traffic Acquisition documentation.
Average Engagement Time
Average engagement time estimates how long the website was actively in focus. It is more useful than assuming every open browser tab represents active reading.
Choose a Useful Date Range
The date selector appears in the upper-right corner of most standard GA4 reports.
Useful reporting periods include:
- The previous 30 days
- The previous calendar month
- The current quarter
- Year to date
- A specific campaign period
Whenever possible, compare the selected range with a previous period or the same period from the previous year. Google explains the available options in its date comparison guide.
A total without context is rarely useful. Three thousand visitors means more when you know whether traffic increased, declined, or produced more meaningful actions than the comparison period.
Seasonal organizations should choose comparisons carefully. A school, campaign, retailer, or nonprofit fundraiser may learn more from year-over-year results than from comparing two consecutive months.
Learn the Main Areas of GA4
The left navigation may vary based on how the property was configured, but most website owners will use three areas:
Reports
Reports contain the standard views used for routine monitoring, including acquisition, landing pages, content, events, and technology.
Explore
Explore provides more flexible analysis for funnels, paths, audience segments, and custom questions.
Admin
Admin contains property settings, access management, data streams, event configuration, and other setup controls. Make changes carefully and confirm permissions before editing important settings.
If a standard report is missing, an Editor or Administrator may be able to add it through the Reports Library.
A Simple Monthly GA4 Routine
A useful review does not need to take hours. Once a month:
- Select the reporting period and comparison.
- Check whether users, sessions, and engagement changed.
- Review where traffic came from.
- Identify the strongest landing pages and most-viewed content.
- Confirm whether key events increased or declined.
- Compare mobile and desktop behavior.
- Write down two or three findings and corresponding next steps.
Avoid collecting numbers without interpretation. Each observation should lead to a question, explanation, or action.
Common Beginner Mistakes
Treating More Traffic as the Only Goal
More visitors are not automatically better. A smaller group of qualified visitors may produce more inquiries, donations, or purchases.
Ignoring Tracking Problems
A sudden decline may reflect a broken tag, form event, consent configuration, or website update rather than an actual performance change. Verify the tracking before drawing conclusions.
Watching Realtime Too Closely
Realtime is useful for testing and launch monitoring. It is not a reliable way to judge long-term website performance.
Trying to Monitor Everything
Choose a small set of metrics connected to the website’s goals. Add more only when a specific question requires them.
What to Learn Next
Once you understand goals, events, metrics, date ranges, and navigation, the next step is learning which reports answer common website questions.
Continue with our guide to the eight essential Google Analytics 4 reports for website owners. It explains Traffic Acquisition, User Acquisition, Landing Pages, Events, device reports, exports, and monthly reporting.
If the data suggests visitors are reaching your website but struggling to take the next step, review Pablo Studio website packages or contact Pablo Studio to discuss a clearer, measurable website.