

.svg)


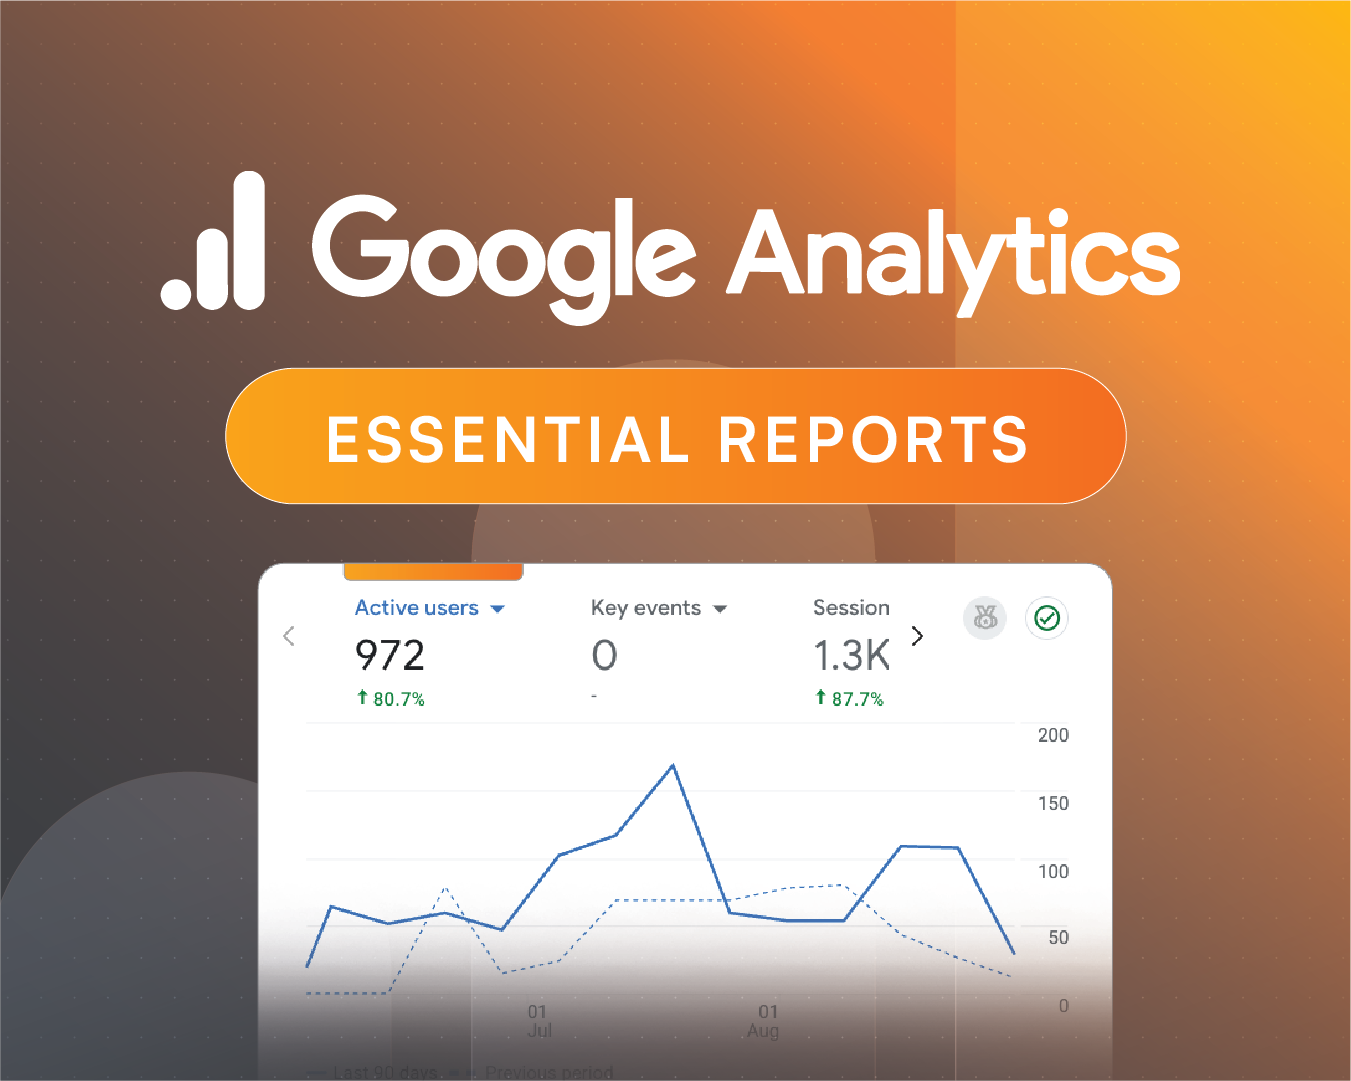

You do not need every number in Google Analytics. You need the few reports that show who is visiting, what they care about, and whether your website is helping your organization move forward.
New to Google Analytics 4? Start with our Google Analytics 4 basics guide before using this report-by-report walkthrough.
Google Analytics 4 can tell you a great deal about your website—but more information does not always create more clarity.
Most business owners, nonprofit leaders, and marketing teams do not need to memorize every Google Analytics feature. They need answers to a few important questions:
- How many people are visiting the website?
- Where are they coming from?
- Which pages are attracting their attention?
- Are visitors taking meaningful actions?
- Is the website improving over time?
This guide covers eight essential Google Analytics 4 reports, the metrics worth watching, and a practical process for turning website data into useful decisions.
The 8 Essential Google Analytics 4 Reports
The exact navigation in your account may vary. GA4 organizes reports based on the business objectives selected for the property, and editors can customize which reports appear in the navigation.
If you cannot find a report, an Editor or Administrator may need to restore it through the Reports Library.
1. Reports Snapshot
Go to: Reports → Reports snapshot
The Reports Snapshot provides a quick overview of website activity. Depending on your setup, it may include users, traffic sources, popular pages, key events, and geographic information.
Use it to identify changes that deserve a closer look. The snapshot tells you what is happening; the detailed reports help explain why.
2. Realtime
Go to: Reports → Realtime
Realtime shows activity from approximately the last 30 minutes. It can display active users, current pages, traffic sources, events, and locations.
Use Realtime to:
- Confirm that tracking is working
- Test a form submission or button event
- Monitor activity after an email or campaign launch
- See which pages visitors are viewing right now
Google also provides a Realtime Pages report for current page activity. Learn more about the Realtime Pages report.
Realtime is useful for immediate monitoring, but it should not be used to evaluate long-term performance.
3. Traffic Acquisition
Go to: Reports → Acquisition → Traffic acquisition
This report answers: Where did the website’s visits come from?
Start with Session default channel group to compare broad traffic categories such as Organic Search, Direct, Referral, Organic Social, Paid Search, Paid Social, and Email.
Change the primary dimension to Session source / medium for more detail. This may reveal sources such as google / organic, a referring website, an email platform, or a paid campaign.
Do not evaluate channels using traffic volume alone. Compare:
- Sessions
- Engagement rate
- Average engagement time
- Key events
- Session key event rate
- Revenue, when applicable
A channel with less traffic may still be more valuable if its visitors are more likely to inquire, donate, register, or purchase. Review Google’s Traffic Acquisition documentation for the full report.
4. User Acquisition
Go to: Reports → Acquisition → User acquisition
User Acquisition answers: How did new visitors first discover the website?
The distinction is important:
- User Acquisition focuses on the first source connected to a new user.
- Traffic Acquisition focuses on the source connected to each individual session.
Someone may first discover a business through Google Search and return later through an email campaign. User Acquisition identifies the original discovery source, while Traffic Acquisition evaluates the visits generated by each channel. See Google’s acquisition-report comparison.
5. Landing Page
Look for Landing page under the engagement or business-objective reports.
A landing page is the first page someone visits during a session. This report answers: Which pages are bringing people into the website?
For each important landing page, review sessions, active users, engagement rate, average engagement time, key events, and session key event rate.
A blog post may attract many organic visitors without directly producing inquiries. A service page may receive less traffic but generate more leads. Both pages can be valuable, but they play different roles.
Use this report to identify strong entry points, pages attracting search traffic, campaign performance, high-traffic pages with weak engagement, and pages that need stronger calls to action.
This is especially useful when evaluating whether your content and Pablo Studio web design services are guiding visitors toward the right next step.
6. Pages and Screens
Look for Pages and screens under the engagement or user-behavior reports.
This report answers: Which content did visitors view?
Look for:
- Your most-viewed pages
- Pages with strong engagement
- Important pages receiving little traffic
- Unexpected or outdated URLs
- Pages contributing to key events
- Content that may need improvement
A popular page is not automatically successful. Evaluate whether it helps visitors understand the organization and move toward a meaningful action.
7. Events and Key Events
Look for the Events and Key events reports under the engagement or business-objective sections.
Events represent actions recorded on the website. Key events are the subset considered important to the organization.
Confirm:
- Which events are being collected
- Which actions are marked as key events
- Whether form submissions are recorded
- Whether event names are understandable
- Whether duplicate events are inflating totals
If leads, purchases, donations, or registrations are missing from GA4, improve the tracking before drawing conclusions from the reports.
8. Technology and Device Reports
Go to: Reports → Tech
Technology reports can show device category, operating system, browser, and screen resolution.
If most visitors use mobile devices but mobile engagement is unusually weak, investigate page speed, navigation, form usability, text size, button placement, and responsive layouts.
Avoid redesigning the website around a tiny visitor segment. Look for patterns supported by enough traffic to make the comparison meaningful.
How to Filter and Compare Reports
Default reports rarely answer every question. Filters and comparisons help narrow the data.
Within a standard report, you can use:
- The search field to find a page, source, or campaign
- Add comparison to compare visitor groups
- The dimension dropdown to change how data is organized
- The date selector to compare reporting periods
- Table headings to sort by a metric
Useful comparisons include mobile versus desktop, organic versus paid traffic, new versus returning visitors, one region versus another, and campaign traffic versus all other traffic.
Apply the comparison before exporting so the report reflects the question you are trying to answer.
How to Download a GA4 Report
To export a standard report:
- Open Reports.
- Navigate to the report you need.
- Select the correct date range.
- Apply the relevant filter or comparison.
- Click Share this report in the upper-right corner.
- Select Download file.
- Choose the available export format.
Google’s GA4 report-export guide covers report sharing, downloading, and access requirements.
Before sending the file, add a short explanation of what changed and why it matters. A spreadsheet without interpretation is not yet a useful report.
When to Use Explorations
Standard reports are best for recurring monitoring. Explore is better for deeper questions.
Explorations can help you:
- Compare specific visitor segments
- Examine paths through the website
- Build a funnel from a landing page to a form submission
- Analyze related groups of pages
- Investigate where visitors leave a process
- Create custom tables using selected dimensions and metrics
Google’s Explorations guide explains the available techniques and setup process.
Standard reports and Explorations can occasionally show different totals because of processing, thresholds, retention settings, filters, and differences in how each reporting area handles data.
A Simple Monthly Website Report
A useful monthly report does not need dozens of charts. A digestible report can include seven sections:
- Executive summary: What improved, what declined, and what deserves attention?
- Audience: Active users, new users, sessions, and returning users.
- Acquisition: Top channels, sources, campaigns, and period-over-period changes.
- Content: Top landing pages, most-viewed pages, and engagement changes.
- Results: Key events, leads, purchases, donations, registrations, or revenue.
- Technology: Mobile-versus-desktop performance and significant technical concerns.
- Recommendations: Two or three actions directly supported by the data.
Common Google Analytics Reporting Mistakes
Reporting Traffic Without Outcomes
More traffic is not automatically better. Connect website visits to meaningful actions such as inquiries, registrations, donations, or purchases.
Focusing on One Month in Isolation
Website performance can fluctuate because of seasonality, campaigns, news coverage, and normal variation. Use comparisons and longer-term trends.
Treating Every Metric as Equally Important
Prioritize measurements connected to the website’s actual goals. Most clients do not need 30 charts when five measurements tell the story.
Ignoring Tracking Problems
A sudden decline may reflect a performance issue—or a broken tag, event, consent configuration, form integration, or website update. Verify the measurement setup before drawing conclusions.
Judging Recent Data Too Quickly
Google Analytics data can continue processing after it is collected. Avoid treating very recent numbers as final when reporting decisions depend on precision.
Sending Data Without Interpretation
A useful report does more than state that organic traffic increased or mobile engagement declined. It explains why the change matters and recommends an appropriate next step.
Turn Website Data Into Decisions
Google Analytics is most valuable when it supports decisions.
Start with the website’s goals. Track the actions connected to those goals. Review how visitors find the website, what they view, and whether they complete meaningful actions. Compare the results over time and finish with a short list of practical improvements.
That is what transforms Google Analytics from a complicated dashboard into a useful tool for growth.
If your reporting reveals that visitors are reaching your website but struggling to take the next step, the problem may be larger than analytics. Explore Pablo Studio website packages or contact Pablo Studio to discuss a clearer, measurable website.